
Why this ranking has no dollar signs in it
This is the one question in the hub where the honest instinct is to reach for a number, so it's worth explaining why we don't. Ranking pests by repair scope and structural consequence tells you something durable: does the fix require a licensed contractor to rebuild framing, or a rag and five minutes? Ranking by a dollar figure tells you something that changes by contractor, by region, and by year — and in this specific subject, the dollar figures in circulation are themselves the problem.
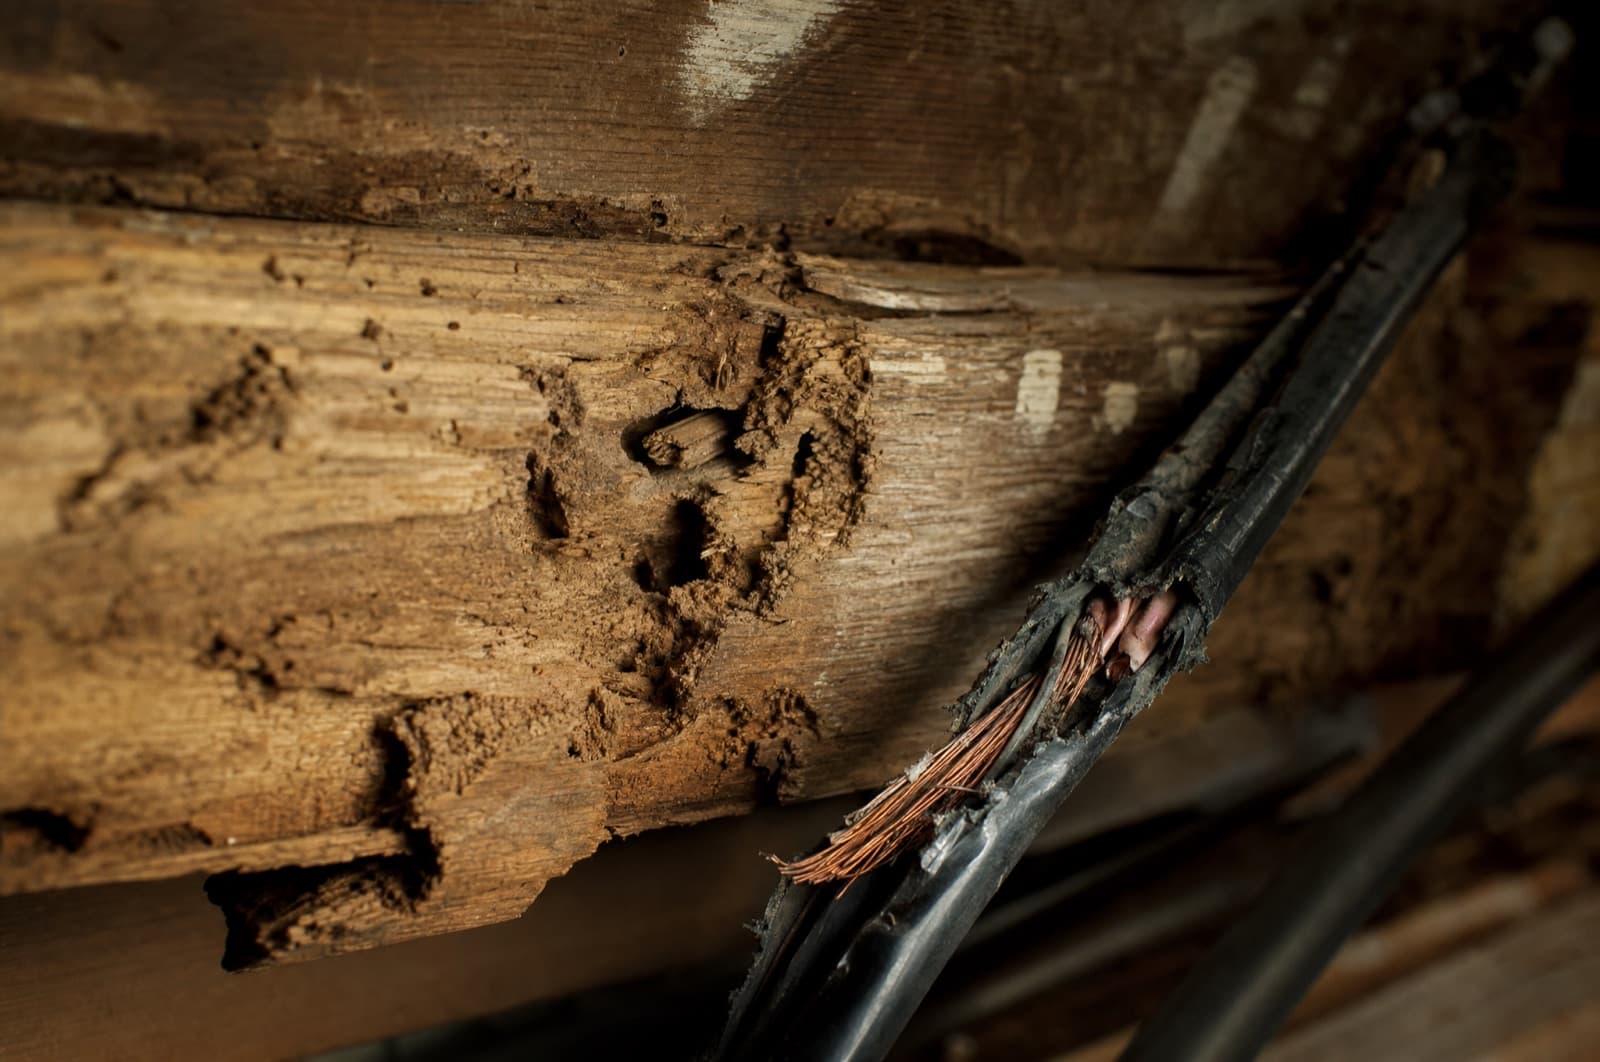
The most repeated cost statistic in pest control is the claim that termites cause a multi-billion-dollar figure in annual damage — 'more than fires, floods, and storms combined.' That line comes from the National Pest Management Association, and it's a pest-industry estimate, not a government damage survey; a trade-press investigation found it was extrapolated from insecticide-sales data and repair-to-treatment cost ratios, not measured losses. The peer-reviewed number it gets confused with, from a 2012 study in the Annual Review of Entomology, is a global total — and roughly 80 percent of that figure traces to species dominance data, with a large specific share attributed by university entomologists to the Formosan subterranean termite, a species that is not established in New Hampshire. So even the number people think they know is measuring the wrong bug in the wrong place. We rank by repair scope instead, because that's the part that's actually verifiable.